lesson
The Law of Demand as a Demand Curve
Introduction
In this section, we represent the law of demand as a demand curve.
After you have worked through this section of the learning unit, you should be able to:
- draw a demand curve
We can also represent the law of demand as a curve, known as the demand curve.
The demand curve is based on our demand schedule.
The graph below shows two axes, namely the vertical axis and the horizontal axis. The vertical axis shows the price (P) of a product or service, say fried chicken pieces. It starts at zero and there are seven price intervals (1, 2, 3, 4, 5, 6 and 7).
The horizontal axis measures the quantity demanded (Qd). There are seven quantity intervals (2, 4, 6, 8, 10, 12 and 14).
Click on the combination points in the table to construct the graph.
Point A in the table corresponds to a price (P) of R7 and a quantity (Qd) of two pieces of fried chicken, as can be read off from the vertical and horizontal axes respectively. To draw point B, we obtain the point that represents a price of R6 and a quantity of four. To draw point C, we obtain the point that represents a price of R5 and a quantity of six. Points D, E, F and G are obtained in the same way.
Table 2 Individual demand for fried chicken pieces


By connecting these points, we obtain a line, shown as D. This is our demand curve for fried chicken pieces.
Watch the following video clips to see how a demand curve is drawn based on data from a demand schedule:
Note the different steps that are followed to draw the demand curve:
- Draw the axes.
- Label the axes.
- Indicate the intervals and write down the values.
- Plot points to show the different price and quantity demanded combinations.
- Join the points to draw the demand curve.
- Label the curve DD or simply D.
Study the following demand curve for packets of cookies and then answer the questions:
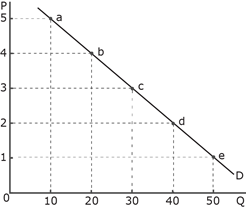
- Which variable is indicated on the horizontal axis?
- Which variable is indicated on the vertical axis?
- What is the quantity demanded (in packets of cookies) at a price of R2?
- What is the quantity demanded (in packets of cookies) at a price of R5?
- What happens to the quantity of packets of cookies demanded when the price declines?
- What happens to the quantity of packets of cookies demanded when the price increases?
- What relationship is illustrated between the two variables, P and Qd? (negative or positive)
- This relationship between P and Qd is so important that it carries the status of a “law” known as the law of ______.
- Would there be any shift of the demand curve if the price were to change in this example?
- Would there be any movement along the demand curve if the price were to change in this example?
- If the price increases, there is a(n) (upward or downward) movement along the demand curve.
- If the price decreases, there is a(n) (upward or downward) movement along the demand curve.
- Which variable is indicated on the horizontal axis? quantity demanded.
- Which variable is indicated on the vertical axis? price
- What is the quantity demanded (in packets of cookies) at a price of R2? 40 packets
- What is the quantity demanded (in packets of cookies) at a price of R5? 10 packets
- What happens to the quantity of packets of cookies demanded when the price declines? It increases.
- What happens to the quantity of packets of cookies demanded when the price increases? It decreases.
- What relationship is illustrated between the two variables (P and Qd)? negative
- The relationship between P and Qd is so important that it carries the status of a “law” known as the law of demand.
- Would there be any shift of the demand curve if the price were to change in this example? No, there is a movement along the curve.
- Would there be any movement along the demand curve if the price were to change in this example? yes
- If the price increases, there is an upward movement along the demand curve.
- If the price decreases, there is a downward movement along the demand curve.
Holding all other things constant, the demand curve _________
Think again
The demand curve indicates that the quantity demanded increases as the price decreases, and that the quantity demanded decreases as the price increases. It is a downward-sloping curve and shifts when the non-price determinants of demand change. A change in the price is represented as a movement along the demand curve.
Correct.
The demand curve indicates that the quantity demanded increases as the price decreases, and that the quantity demanded decreases as the price increases. It is a downward-sloping curve and shifts when the non-price determinants of demand change. A change in the price is represented as a movement along the demand curve.
Think again. It is downward sloping.
The demand curve indicates that the quantity demanded increases as the price decreases, and that the quantity demanded decreases as the price increases. It is a downward-sloping curve and shifts when the non-price determinants of demand change. A change in the price is represented as a movement along the demand curve.
Think again. A change in price cause a movement along the curve and not a shift.
The demand curve indicates that the quantity demanded increases as the price decreases, and that the quantity demanded decreases as the price increases. It is a downward-sloping curve and shifts when the non-price determinants of demand change. A change in the price is represented as a movement along the demand curve.
Your task is to draw a demand curve based on the following table using a pen (pencil) and paper:
| Price (P) |
Quantity demanded (Qd) |
|---|---|
| 7 | 2 |
| 6 | 4 |
| 5 | 6 |
| 4 | 8 |
| 3 | 10 |
| 2 | 12 |
| 1 | 14 |
Below are some of the diagrams from your fellow students:


