Introduction

After you have worked through this section of the learning unit, you should be able to:

  • explain and illustrate with the aid of a production possibilities curve increasing opportunity cost

Production possibilities curve an increasing opportunity cost

If you take a closer look at the opportunity cost of producing laptops, which is represented in the table below, what you will notice is that the opportunity cost increases as more laptops are produced. The opportunity cost of increasing the production of laptops from 0 to 1 000 is 2 000 mobile phones, whereas increasing the production of laptops from 3 000 to 4 000 is 8 000 mobile phones.

Production possibilities and increasing opportunity cost for Zanadu

Combination Laptops Mobile Phones Opportunity cost of increasing production of laptops by increments of a 1 000
A 5 000         0 10 000
B 4 000 10 000 8 000
C 3 000 18 000 6 000
D 2 000 24 000 4 000
E 1 000 28 000 2 000
F       0 30 000

Study the table and answer the following questions:

What is the opportunity cost of increasing the production of laptops from 1 000 to 2 000?

As you can see from the table, it is 4 000 mobile phones (28 000 – 24 000).

What is the opportunity cost of increasing the production of laptops from 2 000 to 3 000?

As you can see from the table, it is 6 000 (24 000 – 18 000).


The reason for this increase in opportunity cost has to do with the suitability of the resources for which they are used. Resources are not all the same, and some resources may be more suitable for the production of mobile phones and others more suitable for the production of laptops.

Production possibilities curve an increasing opportunity cost

Some of these resources are not suitable for the production of mobile phones, and by allocating these resources to the production of laptops (moving from point E to point D), for which the resources are more suitable, the opportunity cost is relatively low – only 4 000 mobile phones need to be sacrificed to increase the production of laptops from 1 000 to 2 000.

As increasingly more resources are allocated away from the production of mobile phones to the production of laptops, moving from point C to point B, less suitable resources are allocated to the production of laptops. Hence the opportunity cost of producing laptops rises – 8 000 mobile phones must be sacrificed to increase the production of laptops from 3 000 to 4 000.

It is because of this increasing opportunity cost that the curve is concave to the origin – that is, it bulges outwards from the origin.

Watch the following video clip on opportunity cost:


Activity

Do the following activity to see if you understand increasing opportunity cost:

Choose the correct words to make the following statements true:

The opportunity cost of producing guns (increases, decreases, stay constant) as more guns are produced.

Correct.  As more guns are produced the opportunity cost of guns - the loss of food – increases as more guns are produced.

Think again. As more guns are produced the opportunity cost of guns - the loss of food – increases as more guns are produced.

Think again. As more guns are produced the opportunity cost of guns - the loss of food – increases as more guns are produced.

The opportunity cost of producing food (increases, decreases, stay constant) as more food is produced.

Correct.  As more food are produced the opportunity cost of food - the loss of guns – increases as more food are produced.

Think again.  As more food are produced the opportunity cost of food - the loss of guns – increases as more guns are produced.

Think again.  As more food are produced the opportunity cost of food - the loss of guns – increases as more guns are produced.

Refer to the diagram below and complete the following statements:

A movement from B to C indicates that the opportunity cost of increasing the production of guns by _______ million is _______ tons of food.

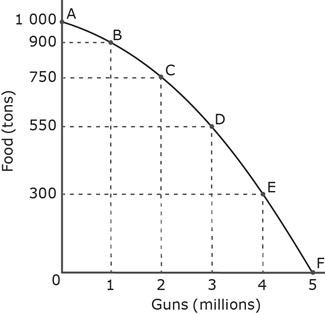
A movement from B to C indicates that the opportunity cost of increasing the production of guns by 1 million is 150 tons of food.

A movement from E to D indicates that the opportunity cost of increasing the production of food by ______ tons is ________million guns.

A movement from E to D indicates that the opportunity cost of increasing the production of food by 250 tons is 1 million guns.