The first point corresponds to a price (P) of R7 and a quantity (Qs) of 14 pieces of fried chicken, as can be seen from the vertical axis and horizontal axis respectively.
To obtain the second point, we obtain the point that represents a price of R6 and a quantity of 12. To draw the next points, we obtain the point that represents a price of R5 and a quantity of 10; the point that represents a price of R4 and a quantity supplied of 8; and so on.
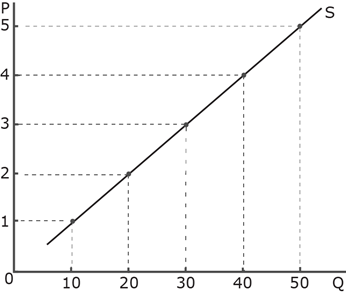
By connecting these points, we obtain a line (shown as S). This, then, is our supply curve for fried chicken pieces.